Tabular Trajectory Data
As long as the offline trajectory data satisfies the data requirements, it
can be passed into PyCFRL. The trajectory inputs and outputs of PyCFRL functions and classes are in the
format of Trajectory Arrays. However, in the real world, the trajectory
data is often stored in a tabular format rather than in Trajectory Arrays. To address this, the
reader module provides the read_trajectory_from_csv() and
read_trajectory_from_dataframe() functions for converting tabular trajectory data to
Trajectory Arrays, as well as the convert_trajectory_to_dataframe() and
export_trajectory_to_csv() functions for converting Trajectory Arrays to the tabular format.
The tabular data inputs (or outputs) of these functions all follow of a particular format, which is
introduced in this section.
For some individual \(i\), let the observed sensitive attribute be \(z_i\). At time \(t\), we denote the set of transitions experienced by this individual by \(\{x_{it}, a_{it}, x_{i,t+1}, r_{it}\}\). For example, at \(t=0\), individual \(i\) could start with some initial state \(x_{i0}\). The individual then takes action \(a_{i0}\), and the environment transitions to a state \(x_{i1}\) and produces a reward \(r_{i0}\). Now, at \(t=1\), the individual takes action \(a_{i1}\), and the environment transitions to \(x_{i2}\) and produces \(r_{i1}\), and so on. Given this notation, the tabular trajectory data need to be in the following format:
The table includes columns that represent the observed sensitive attribute, the state, the action, the reward, and the ID (which should be univariate), respectively, of the individuals in the trajectory data. If the sensitive attribute or state is multivariate, then each component should be in a separate column. The table might also include columns that belong to none of the categories above, which will not be read into Trajectory Arrays.
Each column should have a unique name.
Each row contains the observed sensitive attribute, the current state, the previous action (which resulted in the current state), the current reward, and the ID of a single individual (uniquely identified by the ID) at a single time step. That is, it contains \(z_i\), \(x_{it}\), \(a_{i,t-1}\), \(r_{i, t-1}\), and the ID for some individual \(i\) and time step \(t\).
The rows of each individual should be grouped together from the earliest time step to the latest time step. That is, suppose individual \(i\) has 3 time steps (\(t=0,1,2\)). If row 10 represents individual \(i\) at \(t=0\), then row 11 should represent individual \(i\) at \(t=1\), and row 12 should represent individual \(i\) at \(t=2\).
The individuals in the tabular data might have different numbers of transitions. However, only the first \(T\) transitions will be read for each individual, where the number \(T\) can be specified in the arguments to
read_trajectory_from_csv()andread_trajectory_from_dataframe(). Note that each transition refers to the quartet \(\{x_{it}, a_{it}, x_{i,t+1}, r_{it}\}\), and the components of a transition are not on the same row in the tabular data.
For example, consider a trajectory dataset with three individuals where each individual has three time steps (i.e. two transitions). Then the corresponding tabular data should be organized in the format in the table below. Note that each column can have a custom name (not necessarily “Sens. Attr. 1”, “State 1”, etc.), and entries marked with “ANY” can contain any contents because they will not be read.
ID |
Sens. Attr. 1 |
Sens. Attr. 2 |
State 1 |
State 2 |
Action |
Reward |
Something Else |
|---|---|---|---|---|---|---|---|
1 |
\(z_1^1\) |
\(z_1^2\) |
\(x_{10}^1\) |
\(x_{10}^2\) |
ANY |
ANY |
ANY |
1 |
\(z_1^1\) |
\(z_1^2\) |
\(x_{11}^1\) |
\(x_{11}^2\) |
\(a_{10}\) |
\(r_{10}\) |
ANY |
1 |
\(z_1^1\) |
\(z_1^2\) |
\(x_{12}^1\) |
\(x_{12}^2\) |
\(a_{11}\) |
\(r_{11}\) |
ANY |
2 |
\(z_2^1\) |
\(z_2^2\) |
\(x_{20}^1\) |
\(x_{20}^2\) |
ANY |
ANY |
ANY |
2 |
\(z_2^1\) |
\(z_2^2\) |
\(x_{21}^1\) |
\(x_{21}^2\) |
\(a_{20}\) |
\(r_{20}\) |
ANY |
2 |
\(z_2^1\) |
\(z_2^2\) |
\(x_{22}^1\) |
\(x_{22}^2\) |
\(a_{21}\) |
\(r_{21}\) |
ANY |
3 |
\(z_3^1\) |
\(z_3^2\) |
\(x_{30}^1\) |
\(x_{30}^2\) |
ANY |
ANY |
ANY |
3 |
\(z_3^1\) |
\(z_3^2\) |
\(x_{31}^1\) |
\(x_{31}^2\) |
\(a_{30}\) |
\(r_{30}\) |
ANY |
3 |
\(z_3^1\) |
\(z_3^2\) |
\(x_{32}^1\) |
\(x_{32}^2\) |
\(a_{31}\) |
\(r_{31}\) |
ANY |
For another example, consider sample_input.csv containing the tabular trajectory data shown below.
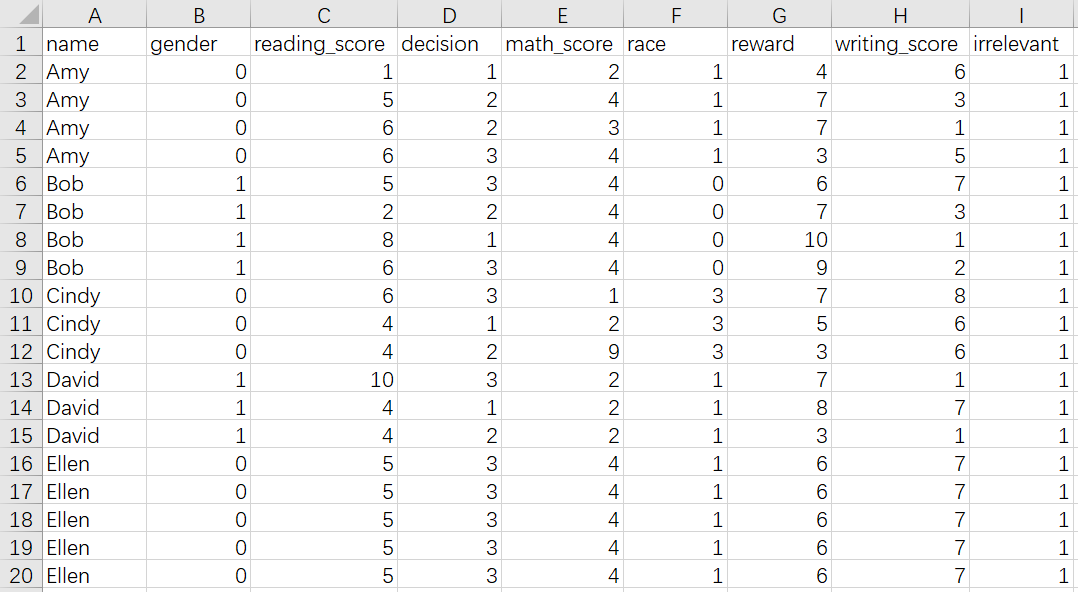
We then read this tabular data by running
zs, states, actions, rewards, ids = read_trajectory_from_csv(
                                            path='./sample_input.csv',
                                            z_labels=['gender', 'race'],
                                            state_labels=['reading_score',
                                                          'math_score',
                                                          'writing_score'],
                                            action_label='decision',
                                            reward_label='reward',
                                            id_label='name',
                                            T=2
                                            )
The output Trajectory Arrays are
zs = np.array([[0., 1.], [1., 0.], [0., 3.], [1., 1.], [0., 1.]])

states = np.array([[[ 1., 2., 6.], [5., 4., 3.], [6., 3., 1.]],
                   [[ 5., 4., 7.], [2., 4., 3.], [8., 4., 1.]],
                   [[ 6., 1., 8.], [4., 2., 6.], [4., 9., 6.]],
                   [[10., 2., 1.], [4., 2., 7.], [4., 2., 1.]],
                   [[ 5., 4., 7.], [5., 4., 7.], [5., 4., 7.]]])

actions = np.array([[2., 2.], [2., 1.], [1., 2.], [1., 2.], [3., 3.]])

rewards = np.array([[7., 7.], [7., 10.], [5., 3.], [8., 3.], [6., 6.]])

ids = array([['Amy'], ['Bob'], ['Cindy'], ['David'], ['Ellen']], dtype=object)
We can also convert the Trajectory Arrays back to the tabular format by running
tabular_trajectory = convert_trajectory_to_dataframe(
                                                 zs=zs,
                                                 states=states,
                                                 actions=actions,
                                                 rewards=rewards,
                                                 ids=ids,
                                                 z_labels=['gender', 'race'],
                                                 state_labels=['reading_score',
                                                               'math_score',
                                                               'writing_score'],
                                                 action_label='decision',
                                                 reward_label='reward',
                                                 id_label='name',
                                                 T_label='time_step'
                                                 )
The output tabular_trajectory is
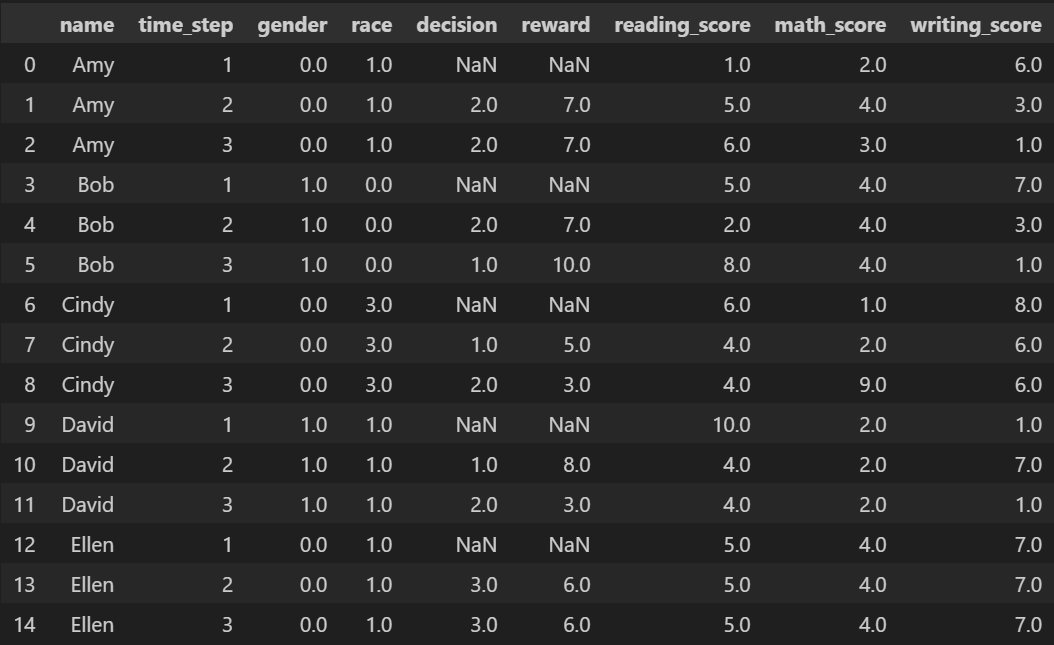
Note that the output tabular trajectory also includes a column that records the time steps. The time steps in this column start from 1.